Few tools in pricing are as widely used as the value map, and few are so often read too literally.
The idea fits on a napkin. Perceived value goes on one axis and price on the other. You plot your own products and your competitors’, and a line runs through the middle where value and price are in balance. Above the line, customers pay more than they think the product is worth. Below it, they get a bargain they did not have to ask for. One picture shows where everyone stands.
The map is especially popular in new product development. Before launch, the team gathers around the chart and asks where the new product should sit, how much value it should offer, and what it should cost.
When companies first use the map this way, I almost always see the same thing. Nobody says it, but everyone assumes the new product belongs further up and to the right. It should be better than what exists, or it has no reason to exist. Superior value is a fine ambition. It is not a requirement.
The dull dot
Take a product that adds very little to what is already on the market. On the value map, it lands right next to existing offerings, quite possibly next to your own. The room goes quiet, because the chart makes it look pointless.
But suppose your company can make this product at a substantially lower cost. Maybe the process is new, the design simpler, or the supply base cheaper. Maybe the engineers built it for the factory rather than for the brochure. Then the dull dot on the chart becomes one of the more interesting options on the table.
Two ways to use it
There are two ways to use it.
Margin play. The first is to leave it exactly where the existing products are. Customers see no difference and pay the same price, and the cost advantage goes straight to the margin. Nothing moves on the value map, but the P&L moves a lot.
Reach play. The second is to give up a little value in exchange for a much lower price. The product steps slightly down the value axis and much further down the price axis, so it lands just below the value line, in the space where a more price-sensitive segment is waiting. These buyers do not need everything the existing products offer, and they could not justify paying for it anyway. Because the cost base is lower, the reduced price still earns a healthy margin.
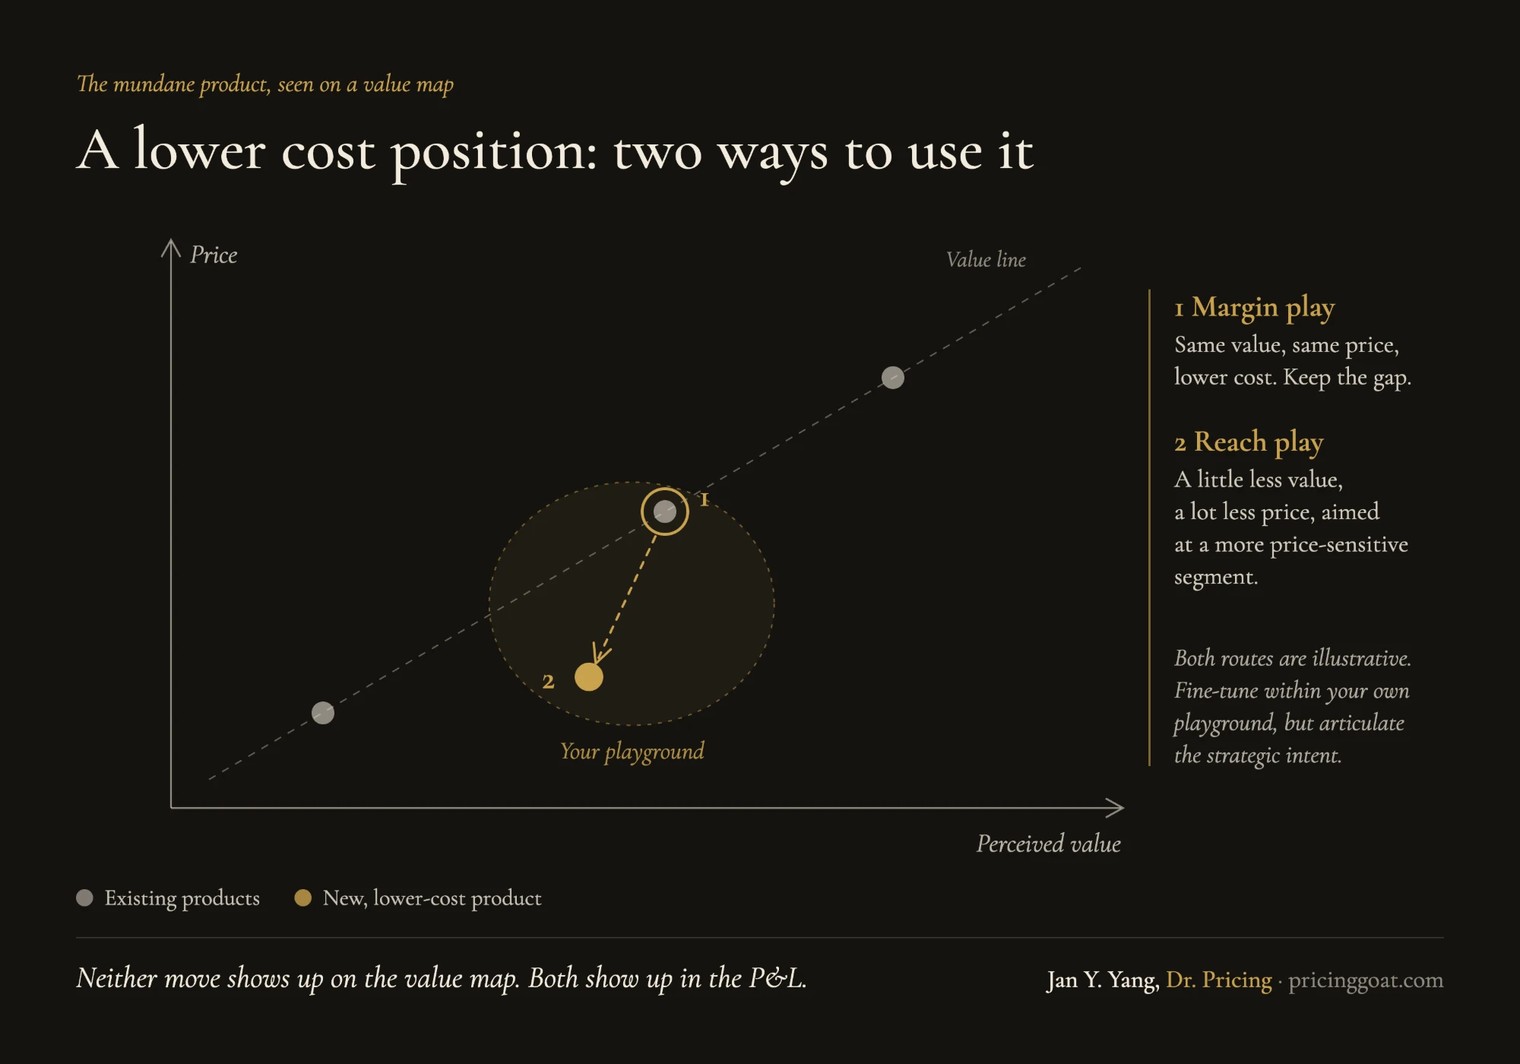
Both routes are illustrative. In practice, every company draws its own playground. It might keep a touch more value on the second route, or price slightly below the existing product on the first. It might mix the two across regions or channels. The exact coordinates are a matter of fine-tuning, and they will shift once real customer data comes in. The strategic intent cannot be fine-tuned in the same way. Before anyone debates where exactly the dot should sit, the team needs to say plainly whether this product exists to widen the margin or to open a segment. Everything else follows from that answer.
The axis nobody draws
Neither option shows up on the value map, because the map shows only two things and profit depends on a third.
Cost is not on the chart. Neither is volume, so you cannot see whether a lower price point opens a market ten times larger or no larger at all. The map will not show how many of your own customers a cheaper product would pull down from your existing range. It will not show whether buyers read the lower price as a bargain or as a sign of lower quality. It will not show how competitors will respond either.
The map shows how customers see you. Whether the product makes sense for your business is a separate question.
What changes in practice
The simplest step is to bring cost into every value map discussion. Write each product’s unit cost or contribution margin next to its dot, or show it as the size of the dot. Once the numbers are on the chart, people stop asking only where a product sits and start asking what each position earns.
The second step goes deeper, into the gate criteria of the development process. Most of those processes ask one question: is the new product better than what is out there? It is worth adding a second way through the gate, namely whether the product is cheaper to deliver at the same value. A product that wins on economics is as legitimate as one that wins on performance. If the organization only rewards performance, engineers will only ever build for performance, and cost innovation will happen by accident if it happens at all.
The third step follows from this: articulate the intent before launch. The margin play and the reach play need different prices, different channels, often different branding, and a different tolerance for cannibalization. The worst outcome is a product nobody quite decided on. It ends up priced somewhere in between, too cheap to protect the margin and too expensive to open a new segment.
The competitor you dismiss
The last point is the one I care about most, and it concerns competitors.
Many Western incumbents have dismissed new entrants, often from China, because their products looked unremarkable on the value map. Those products offered nothing new, just the same thing for less. But the entrants were never competing on value. They were competing on cost. They took the second route, built volume among price-sensitive buyers, and climbed the value axis from there. By the time the threat showed up on the map, the business had already been won.
So when a “me-too” product appears near yours on the chart, the first thing to ask is what it costs to make.
The value map remains one of the best tools I know for bringing the customer’s view into a pricing decision. It just answers a narrower question than people expect. Some of the most profitable products in a portfolio look mundane on the chart, and so do some of the most dangerous competitors. Before you dismiss a product because it does not stand out on the map, find out what it costs to make.
not by default.
Have you seen an “unremarkable” product, your own or a competitor’s, turn out to matter far more than the value map suggested?
First published on LinkedIn, October 2026. Also available in Chinese: 那些价值图没告诉你的事