Almost every B2B price analysis starts with the same chart: net price on the y-axis, customer volume on the x-axis, a cloud of dots and a trend line through it.
It earns its place. In seconds it shows which deals sit far from the line, and the line seems to tell you what a “fair” price looks like at each volume level.
The trouble starts with what people do next. They read the slope as the price of volume and turn it into a discount ladder. For most companies that is a mistake, because the slope is not measuring what they think it measures.
A note on the numbers: the data here is illustrative, 165 deals built to make the mechanics visible. The pattern is one every pricing consultant has seen in real client data.
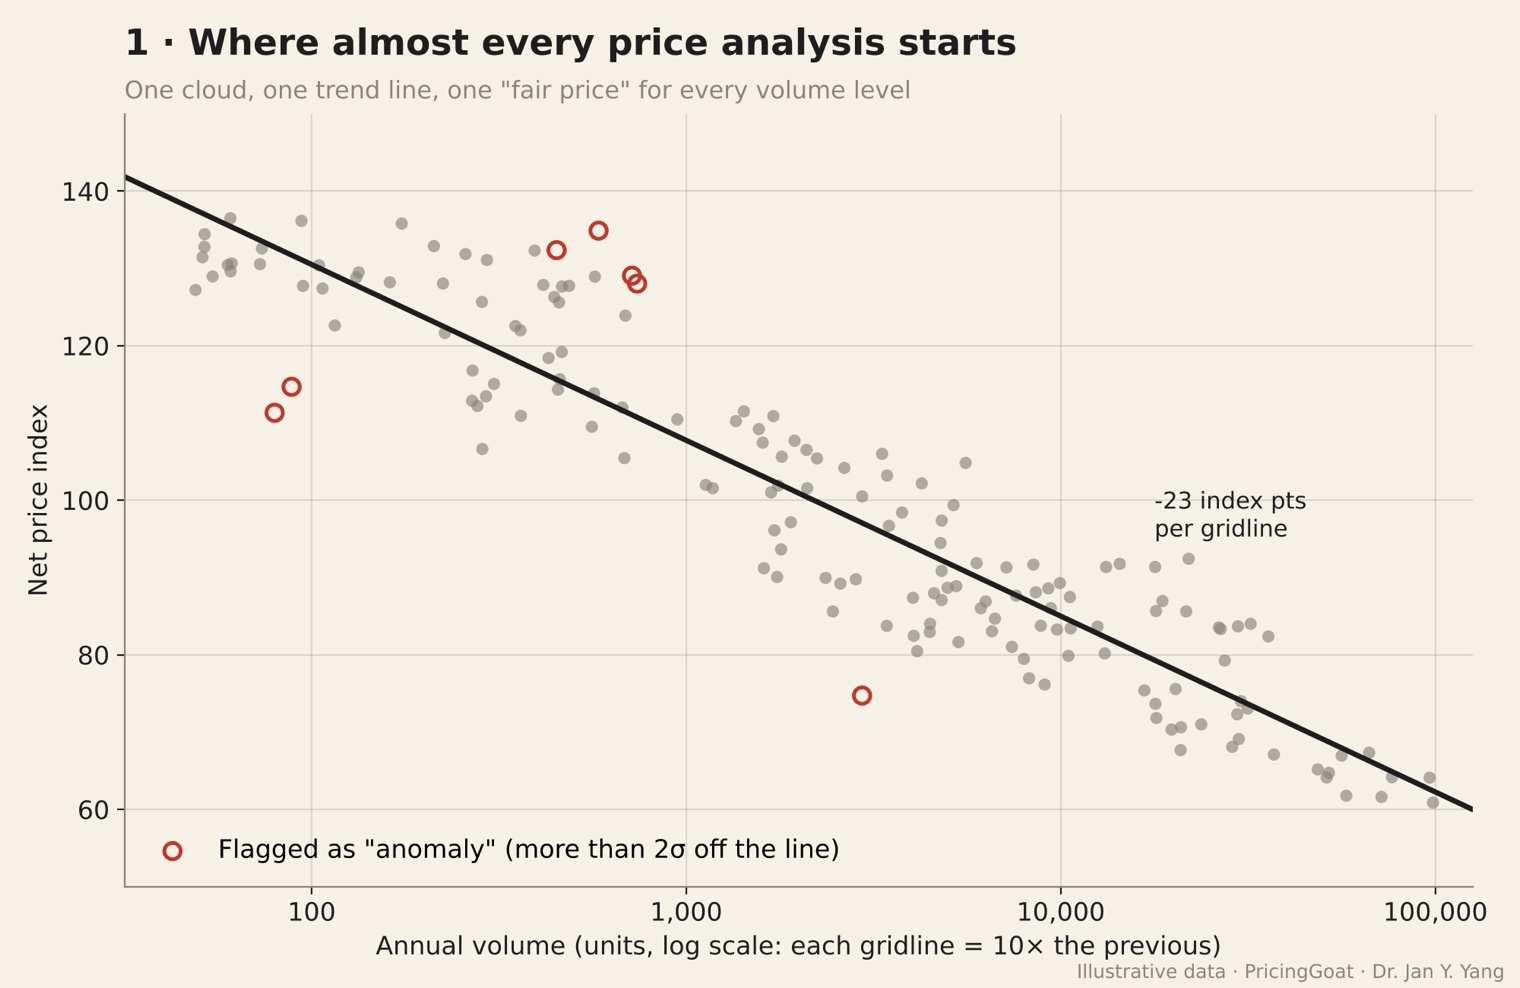
From one gridline to the next, for example from 1,000 to 10,000 units, the line falls by about 23 index points. A standard rule, flagging any deal more than 2σ from the line, marks seven deals as anomalies.
Now colour the same dots by segment, combining industry and company size, and fit a separate line for each.
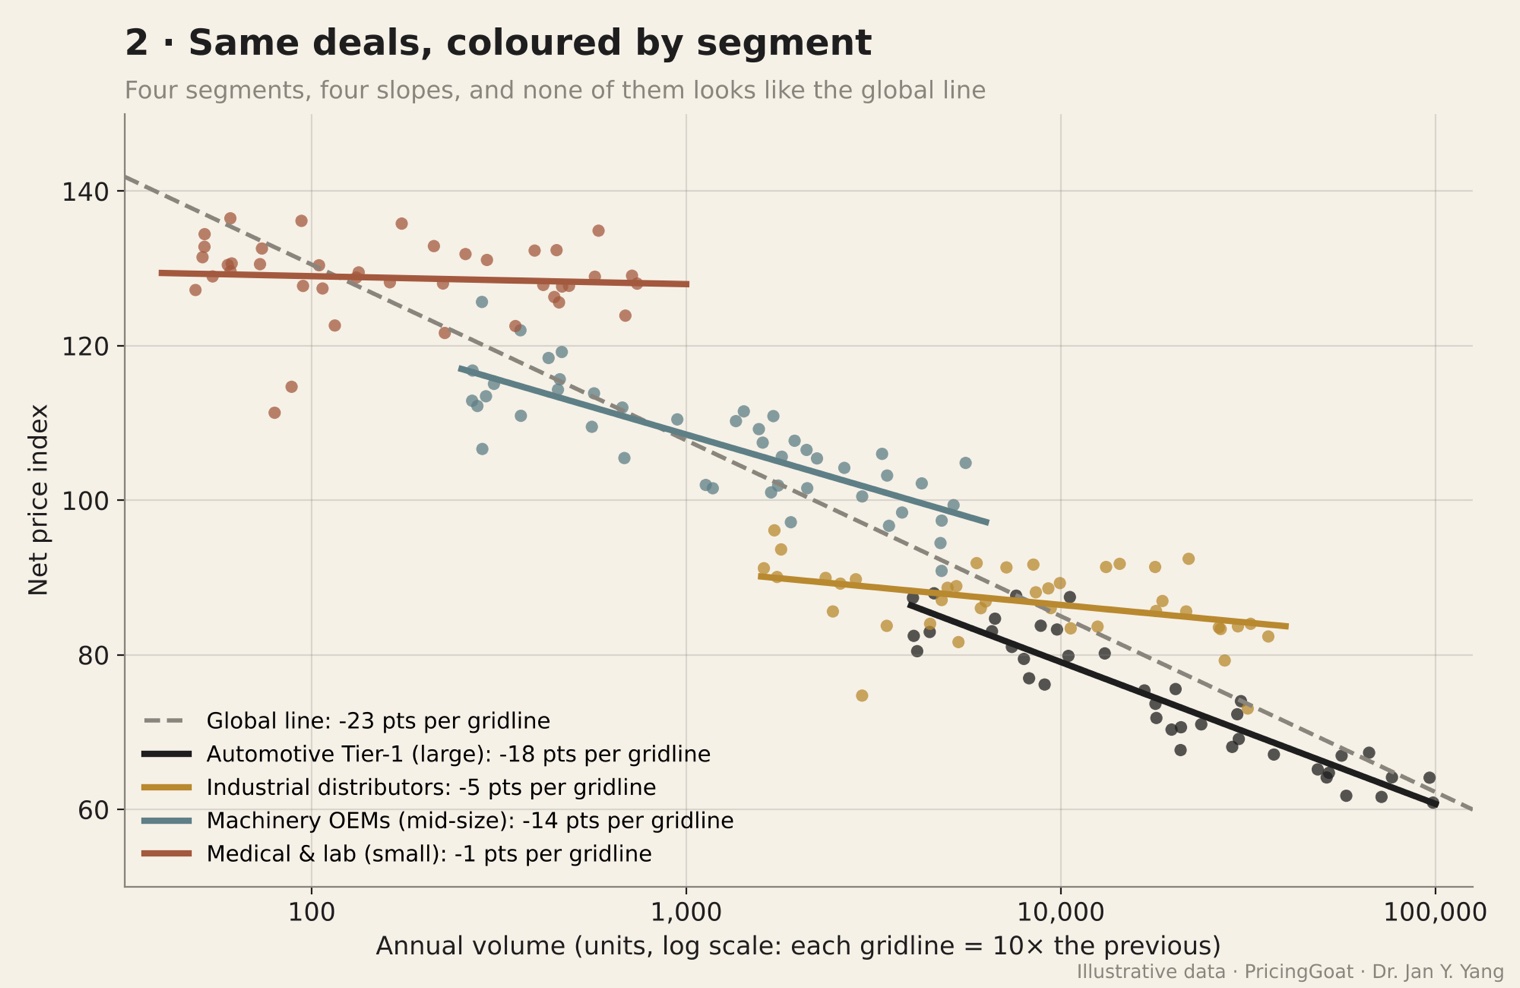
The single line breaks into four markets:
- Automotive Tier-1 (large): slope −18
- Machinery OEMs (mid-size): slope −14
- Industrial distributors: slope −5
- Medical & lab (small): slope −1
The global slope of −23 is steeper than every one of them.
The slope measures your customer mix, not volume
How can the whole be steeper than each of its parts? Because volume and segment move together. In this data, the biggest customers sit in the industries with the lowest price levels, and the smallest customers in the industries with the highest. A single line attributes that industry gap to volume.
The consequence is direct. A discount ladder built on −23 promises more discount per volume step than any segment has ever actually given. You would be overpaying for volume everywhere.
What the single line gets wrong, deal by deal
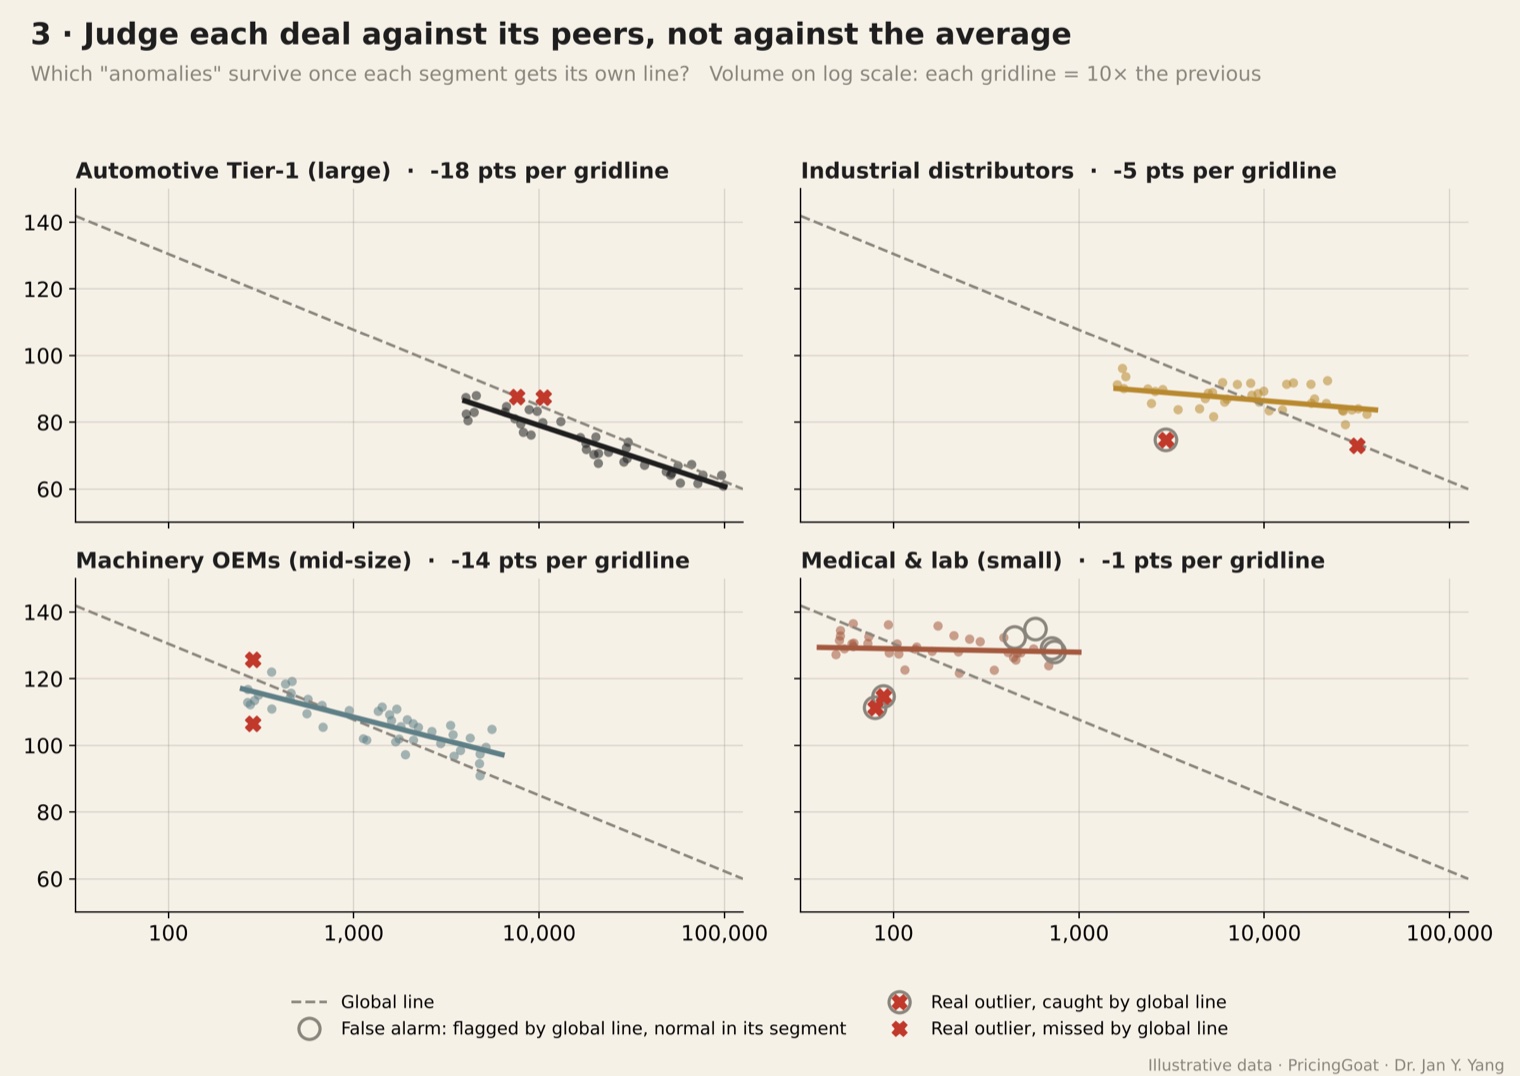
Apply the same 2σ rule, but judge each deal against its own segment’s line.
False alarms. Four lab customers buy 450 to 750 units at an index of about 128 to 135. The global line says the price should be 111 to 116, so they look roughly 15 to 20 percent overpriced. Among their peers, they are perfectly normal. “Correcting” them means giving away margin to customers who never asked for a discount.
Hidden leakage. The largest distributor account buys about 31,500 units at an index of 73. It sits exactly on the global line, so it looks perfectly priced. Its peers sit at about 84. That is 11 points on 31,500 units. If one index point equals €1 per unit, this one account leaks about €350,000 a year, and the global line calls it a model deal.
Hidden premiums. Two automotive deals sit 6 to 9 points above their peers, and one machinery deal about 10 points above its peers. The global line shows none of them.
The global line does catch the most blatant cases: a distributor deal at about 3,000 units priced 14 points below its peers, and two very small medical deals priced around 15 points below theirs. But that is all it catches.
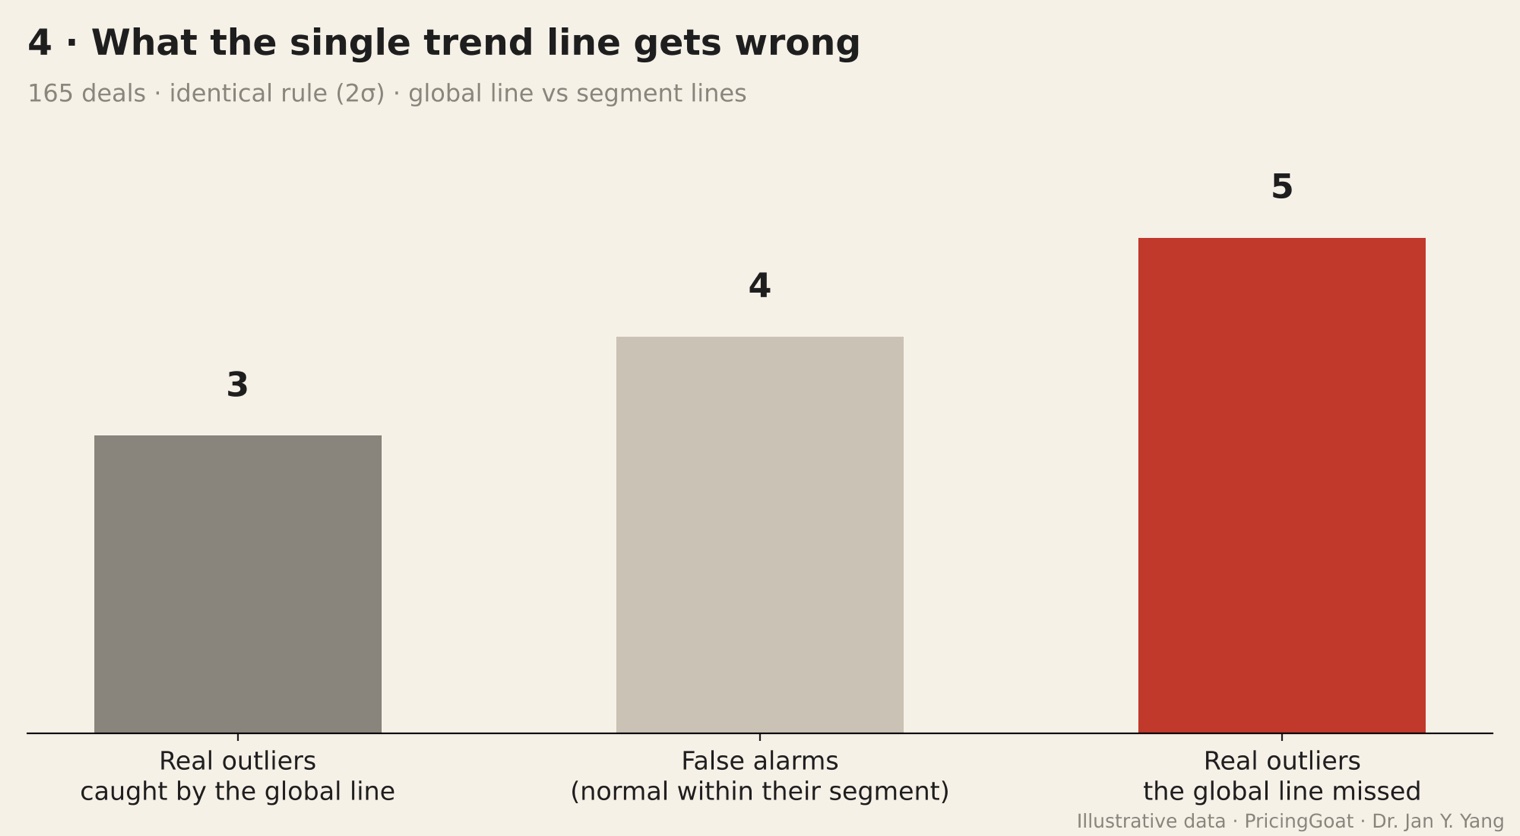
Of the seven deals the global line flags, four are false alarms. Of the eight real outliers, it misses five.
Below the line and above the line are different problems
Deals below their segment line are leakage. The questions are who approved them and how to close the gap.
Deals above the line are either value champions or churn risks. With value champions, learn what those customers value so you can price for it elsewhere. With churn risks, protect the account before a competitor finds it. A single line treats both as noise.
Slopes are hypotheses, not diagnoses
It is tempting to read each slope as the logic of a market. Resist that, at least at first.
A steep slope can mean volume genuinely drives value, through procurement power or lower cost to serve. It can also mean your sales team concedes volume discounts by habit.
A flat slope can mean customers pay for something other than quantity, such as validation, criticality or switching costs. It can also mean nobody has ever tested what that segment would bear.
The chart shows what you have charged, not what you should charge. Each slope is a question to put to that segment’s value drivers.
The hidden risk: segment lines can turn leakage into policy
This is the risk of doing the analysis right. Once each segment has its own benchmark, that segment’s price level becomes normal by definition. Automotive’s low prices are now “in line.” And as soon as segments drive price guidance, sales will lobby to move customers into the cheaper segment.
So segmentation needs governance:
- The segment rules are owned outside sales, by pricing or finance.
- The criteria are documented and reviewed every year.
- The segment line serves as a benchmark, never as the target. The target comes from value.
Before you trust any of these lines
From segments to peer groups
Industry and size are convenient segments, but they are rarely the reason a customer pays what it pays. The better unit for pricing is the peer group: customers who share the attributes that drive value and cost, such as application, criticality, cost to serve and potential, and who should therefore pay coherent prices.
Two rules make peer groups work:
If you group customers by what they already pay, every group will look coherent, and your leakage becomes the standard.
A sound peer group shows a tight price band. A wide band means either the grouping is wrong or the pricing is.
Get this right, and every price discussion has a reference point: what do customers like this one pay, and why should this one be different?
More on how to build peer groups in my next piece.
A single trend line answers the question “What is the average price at this volume?” The question that matters is “What should this customer pay, given who they are and what they value, and who decided?”
Segment lines tell you where to look. Peer groups tell you what to compare against. Value tells you what is right, and governance keeps it that way.
not by default.
How many of your “anomalies” survive once you split the plot by segment? I’d be curious to hear.
First published on LinkedIn, October 2026. Also available in Chinese: 一条趋势线,四个市场